
We Tested:
What if I told you that an ETF tied to Nvidia—one of the most volatile stocks on the planet—could pay you every single week? Not quarterly. Not monthly. Weekly.
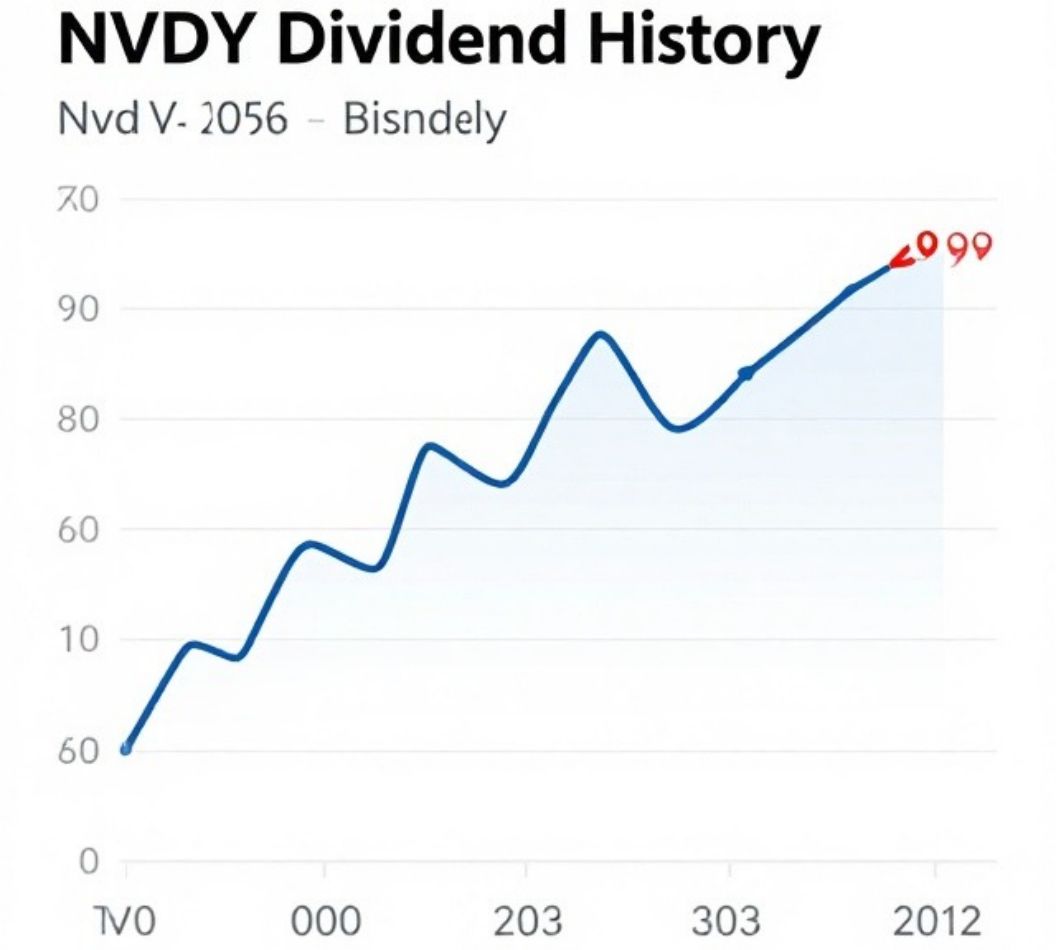
That’s the promise of the YieldMax NVDA Option Income Strategy ETF (NVDY), a fund that has captured the imagination of income investors since its launch in May 2023. With a dividend yield that has ranged from 50% to over 80% depending on the measurement period and market conditions, NVDY has become the poster child for the “covered call ETF” boom.
But here’s the uncomfortable question every potential investor must confront: Is that massive yield real income, or are you simply getting your own capital back?
The answer, as we’ll explore in this deep dive, is far more nuanced than either the bulls or bears would have you believe. Let’s break down NVDY’s complete dividend history, the mechanics behind its payouts, and what the 2026 landscape means for your portfolio.
Background: What Exactly Is NVDY?
The Nuts and Bolts
NVDY is an actively managed ETF launched on May 10, 2023, by YieldMax, a firm specializing in option income strategies. The fund’s objective is deceptively simple: generate high weekly income by selling call spreads on NVIDIA Corp (NVDA) while maintaining synthetic long exposure to the stock.
Here’s how it works in plain English:
-
Synthetic Long Exposure: Instead of buying NVDA shares outright, NVDY uses options to replicate the price movements of Nvidia stock.
-
Covered Call Writing: The fund sells call options with strike prices typically 0% to 15% above NVDA’s current price, collecting premiums that become your distributions.
-
Cash Collateral: The fund holds U.S. Treasurys as collateral, adding a small layer of safety.
The critical trade-off? You cap your upside. If NVDA skyrockets 50% in a month, NVDY will capture only a fraction of that gain. But you still collect the option premium, which becomes your dividend.
The Fund at a Glance (as of late 2026)
| Metric | Value |
|---|---|
| Inception Date | May 10, 2023 |
| Expense Ratio | 1.09% |
| Assets Under Management | ~$1.4 billion |
| Distribution Frequency | Weekly (since October 2025) |
| Most Recent Distribution Rate | ~30–50% (varies by measurement) |
The Complete NVDY Dividend History: A Timeline
2023–2024: The Monthly Era Begins
When NVDY launched, it paid monthly distributions. The early payouts were relatively modest by today’s standards, but they grew rapidly as Nvidia’s volatility surged.
By early 2024, NVDY was paying over $2.50 per share per month**. In March 2024 alone, the distribution hit **$2.62 per share—a staggering amount for a fund trading around $20 at the time.
The full-year 2024 dividends per share totaled $19.53, creating a yield that exceeded 100% on the fund’s starting NAV. This was the peak of the “yield mania” phase.
2025: The Great Normalization
As Nvidia’s volatility moderated and the fund’s NAV eroded from repeated distributions, payouts began to shrink. By mid-2025, monthly distributions had fallen to $0.67–$1.03 per share.
Then came the October 2025 structural change: YieldMax announced it would transition all single-stock option income ETFs, including NVDY, to weekly distributions.
The shift was framed as an enhancement—”more frequent income opportunities”—but it also served a practical purpose. Smaller, more frequent payouts are less shocking to the NAV than large monthly distributions.
2026: The Weekly Rhythm
In 2026, NVDY settled into a weekly payout pattern. Weekly distributions have ranged from $0.0848 to $0.1435 per share, with most weeks falling in the $0.10–$0.12 range.
The trailing twelve-month (TTM) dividend per share as of late 2026 sits around **$9.26**, translating to a yield of approximately **65.52%** based on the fund’s price near $14.
But here’s the catch: that TTM figure includes the larger payouts from early 2025. The forward distribution rate—based on the most recent weekly payout annualized—is significantly lower, often cited in the 30–50% range.
The Return of Capital Problem: Where Your “Dividend” Really Comes From
This is the section most articles gloss over—and it’s arguably the most important thing you need to understand about NVDY.
What Is Return of Capital (ROC)?
When NVDY pays you a distribution, that money comes from one of two sources:
-
Option Premium Income: Genuine profit from selling call options.
-
Return of Capital (ROC): Your own invested money being returned to you.
When a distribution is classified as ROC, it reduces your cost basis in the fund. You’re not earning income—you’re essentially getting a partial refund on your investment.
The ROC Reality for NVDY
According to YieldMax’s own disclosures, over 90% of recent distributions have been classified as return of capital rather than genuine income.
Let that sink in. For every $100 NVDY pays you, roughly **$90 is your own money coming back**.
This doesn’t mean NVDY is a scam—it’s a structural feature of how covered call ETFs work when the underlying stock’s volatility doesn’t generate enough premium to sustain the advertised yield. But it does mean that chasing NVDY for “income” without understanding ROC is a recipe for disappointment.
Why This Matters for Your Taxes
ROC isn’t always bad from a tax perspective. It’s not taxed as ordinary income in the year you receive it—instead, it reduces your cost basis, and you only pay capital gains taxes when you sell. But if your cost basis drops to zero, subsequent ROC becomes taxable as capital gains.
The bottom line: ROC is a deferral, not an elimination, of tax liability.
NVDY vs. NVDA: The Total Return Reality Check
| Year | NVDY Total Return | NVDA Total Return |
|---|---|---|
| 2024 | +114.23% | +171.25% |
| 2025 | +27.65% | +38.92% |
| 2026 (YTD) | +15.36% | +16.79% |
Data assumes dividends reinvested.
The pattern is unmistakable: NVDY consistently underperforms NVDA in total return, even when you reinvest every distribution. In 2025, the gap was over 11 percentage points. The capped upside—the structural cost of the covered call strategy—means you’re trading potential capital appreciation for current income.
The critical question: Is that trade worth it for you?
If you’re a retiree who needs cash flow now and can tolerate NAV erosion, NVDY might serve a purpose. If you’re a growth investor with a 20-year horizon, the math overwhelmingly favors owning NVDA directly.
Practical Tips: How to Evaluate NVDY for Your Portfolio
1. Focus on Forward Distribution Rate, Not TTM Yield
Websites often quote NVDY’s “yield” using trailing twelve-month distributions. This is misleading when payouts are declining. Always calculate:
Forward Rate = (Most Recent Weekly Distribution × 52) ÷ Current Price
If the most recent weekly payout was $0.10 and the price is $14, the forward rate is:
($0.10 × 52) ÷ $14 = 37.1%
That’s very different from the 65%+ TTM figure you’ll see on many sites.
2. Track the NAV Trend
NVDY’s NAV has steadily declined since inception. If the NAV keeps falling while distributions stay flat, your total return is negative even if you’re “getting paid.”
3. Use a “Total Return” Lens
Don’t look at distributions in isolation. Compare NVDY’s total return (price change + distributions) to NVDA’s total return over the same period. If NVDY consistently lags, the income is coming at a real cost.
4. Size Your Position Appropriately
Given the volatility and ROC risk, NVDY should be a satellite holding, not a core position. Most financial professionals suggest limiting high-yield covered call ETFs to 5–10% of a portfolio—and only if you fully understand the mechanics.
Common Mistakes and How to Avoid Them
Mistake #1: Chasing the Highest Advertised Yield
The trap: Buying NVDY because a website says it yields 65%.
The fix: Calculate the forward rate yourself. The 65% figure is backward-looking. The forward rate is likely 30–40%.
Mistake #2: Reinvesting Distributions Without Tracking NAV
The trap: Using DRIP (dividend reinvestment) and assuming your account balance reflects real growth.
The fix: Track both the share count and the NAV per share. If NAV is declining, you may be accumulating more shares of a shrinking pie.
Mistake #3: Ignoring the Upside Cap
The trap: Assuming NVDY is “basically NVDA with dividends.”
The fix: Understand that NVDY will not capture NVDA’s full upside. If NVDA doubles, NVDY might gain only 30–50%. This cap is the price of the income.
Mistake #4: Holding in a Taxable Account Without Understanding ROC
The trap: Assuming distributions are taxed like ordinary dividends.
The fix: Consult a tax professional. ROC reduces your cost basis, which affects your capital gains when you sell. The tax treatment can be complex.
Pros, Cons, and Balanced Analysis
The Bull Case for NVDY
-
High current income: Even at a 30–40% forward rate, the cash flow is substantial.
-
Weekly payouts: Frequent distributions can help with cash flow management.
-
Nvidia exposure: You maintain some upside participation in NVDA’s price movements.
-
Liquidity: With ~$1.4 billion in AUM, NVDY trades with tight spreads.
The Bear Case
-
NAV erosion: The fund’s price has declined from over $18 to around $14.
-
Capped upside: You miss significant gains when NVDA rallies hard.
-
ROC dominance: Over 90% of distributions are return of capital.
-
High expense ratio: 1.09% is a meaningful drag.
-
Complexity: The options strategy is difficult for most investors to fully grasp.
The Balanced Verdict
NVDY is not a “buy and forget” investment. It’s a tactical tool for income-focused investors who:
-
Understand and accept ROC
-
Have a shorter time horizon
-
Can tolerate NAV volatility
-
Use it as a small satellite position
For everyone else, a simple NVDA holding or a diversified dividend ETF likely serves you better.
Future Trends: What’s Next for NVDY?
1. Continued Yield Compression
As Nvidia’s volatility normalizes (and it has been trending downward in 2026), option premiums shrink. That means lower distributions unless NVDY’s managers adjust their strike prices or expiration strategies.
2. The Weekly Payout Experiment
YieldMax’s move to weekly distributions across its product suite is a test. If investors respond positively (through increased AUM), expect competitors to follow. If not, we may see a reversion to monthly payouts.
3. Increased Regulatory Scrutiny
The SEC has shown growing interest in complex ETF products. The heavy ROC component of NVDY’s distributions could attract regulatory attention, potentially leading to stricter disclosure requirements.
4. Competition Heats Up
Funds like the Roundhill Small Cap 0DTE Covered Call Strategy ETF (RDTE) and others are competing for the same income-hungry investors. NVDY’s 67% return vs. RDTE’s 30% over the past year suggests NVDY has an edge—but that could change.
Conclusion: Key Takeaways
-
NVDY’s dividend history shows a clear evolution: from large monthly payouts in 2024 to smaller weekly distributions in 2026.
-
The advertised yield (65%+) is backward-looking. The forward rate is likely 30–40%.
-
Over 90% of distributions are return of capital, not genuine income.
-
NVDY consistently underperforms NVDA in total return, due to the capped upside of the covered call strategy.
-
NVDY can be useful as a small satellite position for income-focused investors, but it is not a replacement for owning NVDA directly.
-
Always calculate the forward distribution rate and track NAV trends before investing.
Quick Summary Box
| What NVDY Is | What NVDY Is Not |
|---|---|
| A high-frequency income ETF | A growth investment |
| A way to monetize NVDA volatility | A substitute for owning NVDA |
| A tactical satellite position | A core portfolio holding |
| A complex options strategy | A simple dividend fund |
Detailed FAQs
Q: How often does NVDY pay dividends?
A: Since October 2025, NVDY pays weekly distributions, typically declared on Wednesdays with payment on Fridays.
Q: What is NVDY’s current dividend yield?
A: The trailing twelve-month yield is approximately 65.52% as of late 2026, but the forward rate based on recent weekly payouts is closer to 30–40%.
Q: Is NVDY’s dividend safe?
A: “Safe” is relative. The distributions are not guaranteed and depend on option premiums. Over 90% of recent distributions have been return of capital, meaning they reduce your cost basis rather than represent genuine income.
Q: Does NVDY pay qualified dividends?
A: Generally, no. Most distributions are classified as ordinary income or return of capital. The tax treatment depends on your specific situation—consult a tax professional.
Q: What is the expense ratio of NVDY?
A: The expense ratio is 1.09%, which is on the higher end for an ETF but typical for actively managed options strategies.
Q: Can I hold NVDY in a retirement account?
A: Yes, NVDY can be held in IRAs and other retirement accounts. However, the ROC component may have different tax implications in tax-advantaged accounts. Consult your advisor.
Q: How does NVDY compare to JEPQ or other covered call ETFs?
A: NVDY is more concentrated (single stock: NVDA) and higher-yielding than diversified covered call ETFs like JEPQ. It also carries higher single-stock risk.
Sources
-
StockAnalysis.com — NVDY Dividend History, Dates & Yield
-
YieldMax Official Website — NVDY Fund Page
-
FinanceCharts.com — NVDY Dividends Per Share History
-
YieldMax Press Release — Transition to Weekly Distributions
-
ETF.com — NVDY Summary Data
-
PortfoliosLab — RDTE vs. NVDY Comparison
-
TotalRealReturns.com — NVDY vs. NVDA Total Return Chart
-
Yahoo Finance — NVDY Capital Return Risk Analysis

Novara Lin
Senior Editor & Clean Beauty Analyst
Novara Lin is a clean beauty researcher and wellness editor dedicated to demystifying modern skincare and evidence-based living. With a background in formulation science and consumer health reporting, she specializes in analyzing complex ingredient profiles, evaluating product safety, and bridging the gap between clinical research and daily self-care routines. Her work focuses on helping readers cut through industry noise to build minimal, highly effective routines rooted in transparency and skin health. When she isn’t testing active formulations or auditing non-toxic household choices, Novara leads editorial strategy for NovaRa Pure.